
JavaScript & CSS – How to Determine Script Usage
Once you have your fancy new website looking pretty, one of the next things you might do is to try and optimize various aspects of it. For example, this may include optimizing images so they load more quickly; making sure the site is easily accessible for those with impaired vision, and ensuring the site is usable on various types of device. These are all excellent ways to improve a site; another is to ensure that the JavaScript and CSS files being included in your pages are actually being utilized properly. By ensuring good script usage techniques your pages can often load much faster.
Why Check Script Usage?
Checking script usage is not always at the forefront of every webmaster's mind, yet it's probably one of the easier ways to speed up your website. So spending a few minutes to check your script usage can be time well spent. In particular, websites created with content management-type systems can be vulnerable to JavaScript and CSS bloat, where sometimes entire files (JQuery, or other libraries, for example) are loaded in pages but not ever used. This is sometimes just laziness by the theme developers, including things just in case! However, you should never miss an opportunity to cut bloat and have your pages load faster if you're able to.
Take Note:
Note that the following guide is currently accurate (at the time of writing) for the Chrome browser, MS Edge, Opera, and Avast Secure Browser. The same functionality does not exist (yet) for Firefox. Similar functionality may or may not exist in other untested browsers.
How to Check Script Usage - Quick Version
A more detailed version of the steps is provided in the next section if you have any trouble following this quicky version.
- Visit the page/site you want to test, and open up the browser Developer tools section
- Click the vertical three-dots icon (usually top right), and select "Show console drawer"
- A new section (the console drawer) should now be visible
- In this new section should be another 3-dots vertical menu; select it and choose "Coverage"
- Click the record button (a circle-icon); a few items may appear in the Coverage section, but you now want to refresh the page you're testing (so just press the F5 function key, or right click it and Reload)
- You should see lots of activity in the Coverage section, listing CSS and JavaScript files which are being downloaded. The tool is also calculating how much each of these files is utilized.
- Once the page rendering has completed, you'll be left with a list of files, along with their size, the number of bytes in each file not being used, and the percentage of non-use.
- Ideally you'd like figures of 0 and 0% in the unused bytes column, meaning the file is fully utilized - but you'll be lucky!
- The last column in the display shows Usage Visualization. The files displaying a mostly-red bar have a low percentage of coverage (i.e. little of the code is used on this page); you'd much rather have no red at all, which means the code is well-utilized.
- Here's the good bit: if you select a file name (by clicking on it) in the Coverage section, then another little window (above) will display the code in question, and will display the sections of code which are being used (a green/turquoise line denotes the code in use), while a red line at the side denotes code which is never used on the page.
- Using the knowledge of which code is being used and which code is never used, you may be able to trim down some of your code, or just copy the bits which you do use into separate files, and load those instead of the bigger files which are poorly utilized.
- Remember that just because JS or CSS code may not be used on one page of the site, doesn't mean that it isn't used anywhere; some of it may be used elsewhere on your website.
Hopefully that was mostly clear to you, but a more detailed version with images provided is also given below.
How to Check Script Usage - Detailed Version
Checking script usage can easily be done automatically, using tools included with most of the popular browsers (Chrome, MS Edge, Opera, but excluding FireFox).
The tool is known as "Coverage", and is available in the Developer Tools area. So, first of all, visit the website you wish to check coverage for, and then let's get into the Development area:
Step 1:
In Chrome: either press F12, or select "More tools" -> "Developer tools" from the "three dots" option in the toolbar of Chrome browser.
In MS Edge: exactly the same as in Chrome
In Opera: select the Menu button (top left), and then "Developer" -> "Developer tools"
Firefox: the coverage tool does not currently exist in Firefox, although other developer tools may be reached by selecting the burger menu, and choosing "More tools" -> "Web Developer Tools"
Hopefully, when you've done that, you'll have something resembling the image below, with the browser window split between a scaled version of the website page you're on, and the developer tools, per the first image below:
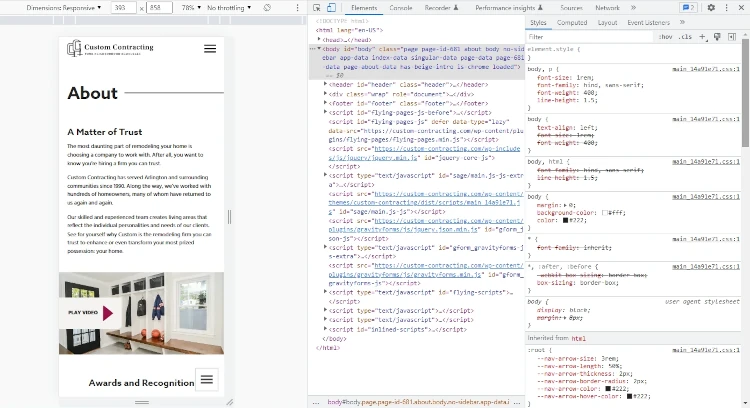
Developer Tools, in Chrome
Step 2:
Now click the vertical three-dots icon (usually top right, and as denoted by the arrow in the image below), and select "Show console drawer" from the menu which appears:
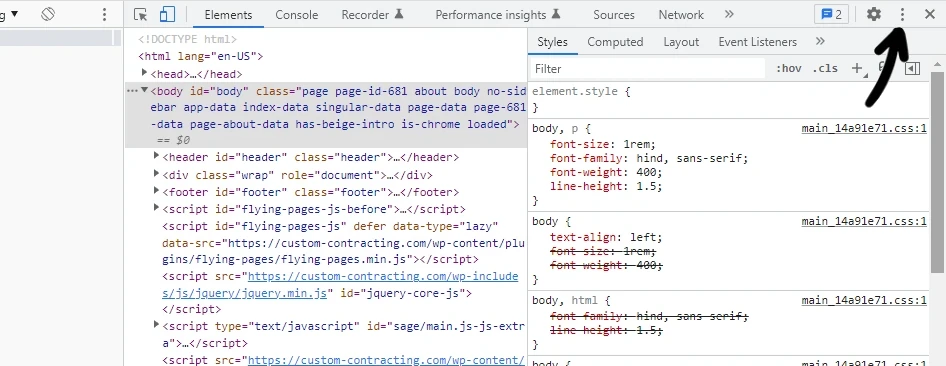
Developer Tools - Select "Show Console Drawer"
Show Console Drawer
Step 3:
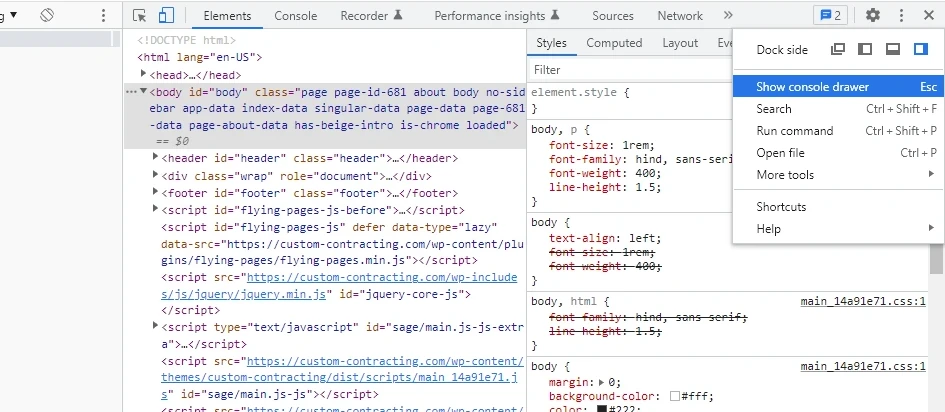
The console drawer should now be visible (probably in the bottom portion of the developer tools) as shown below. In this new section should be another 3-dots vertical menu, as indicated by the arrow; select it and choose "Coverage":
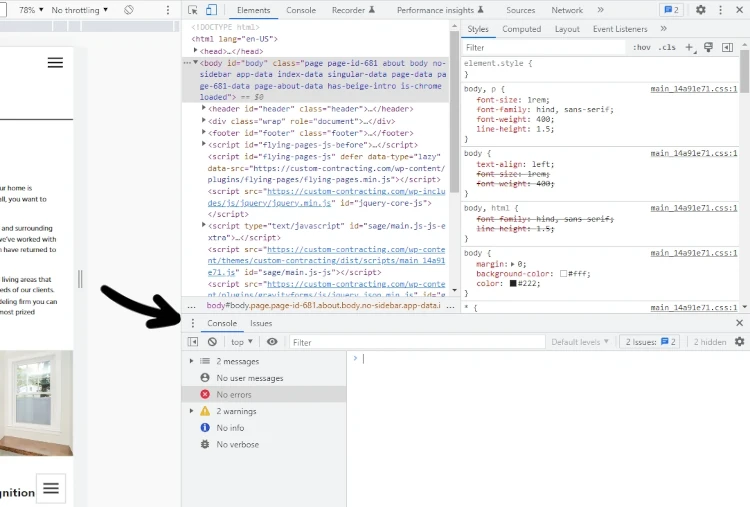
Console drawer is displayed
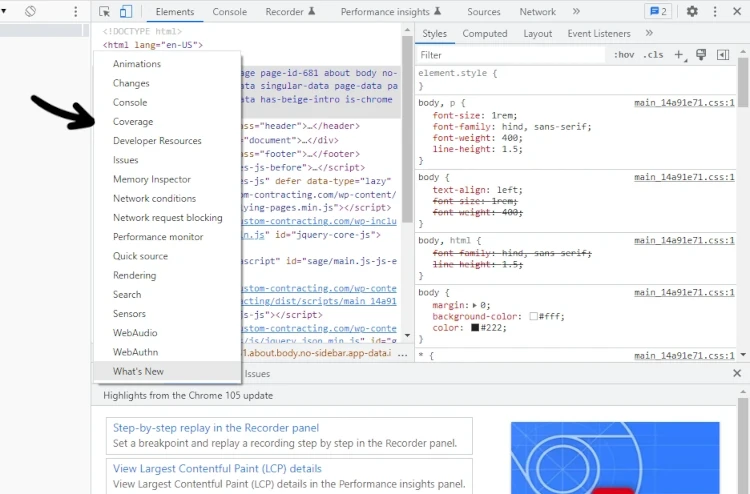
Select the Coverage Tool
The image directly above shows the menu which appears when you click the 3-dot vertical menu from the console drawer (as indicated in the prior image).
Step 4:
A "Coverage" tab should now be visible in the console drawer area, as indicated in the image below:
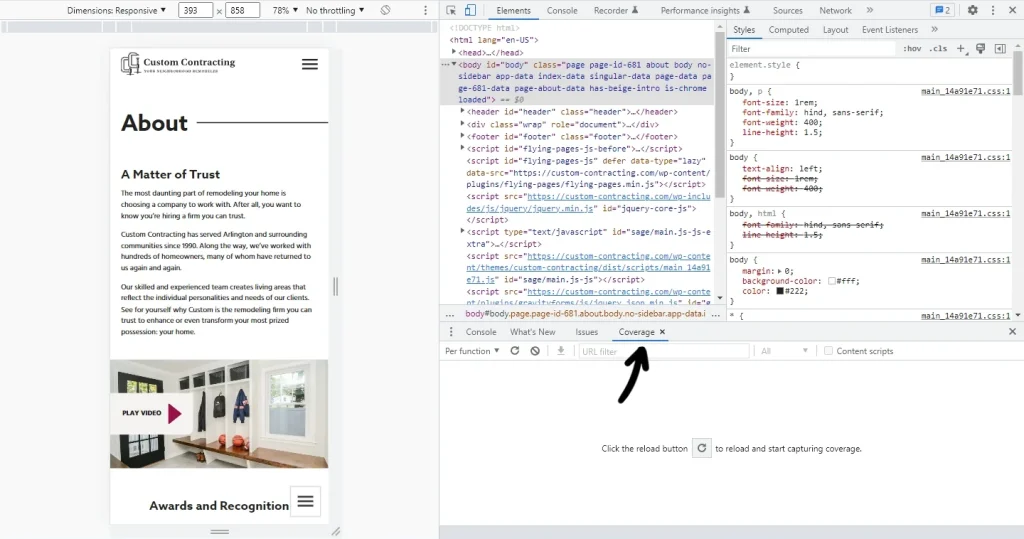
Coverage Tool
Step 5:
Now click the record button (a circle-like icon); a few items may appear in the Coverage section, but you now want to refresh the page you're testing (so just press the F5 function key, or right click it and Reload).
You should see lots of activity in the Coverage section as the page downloads, listing CSS and JavaScript files which are being examined. The tool is calculating how much each one of these files is utilized on the given page.
Once the page rendering has completed, you'll be left with a list of files, along with their size, the number of bytes in each file not being used, and the percentage of non-use.
The image below shows something similar to what you should see:
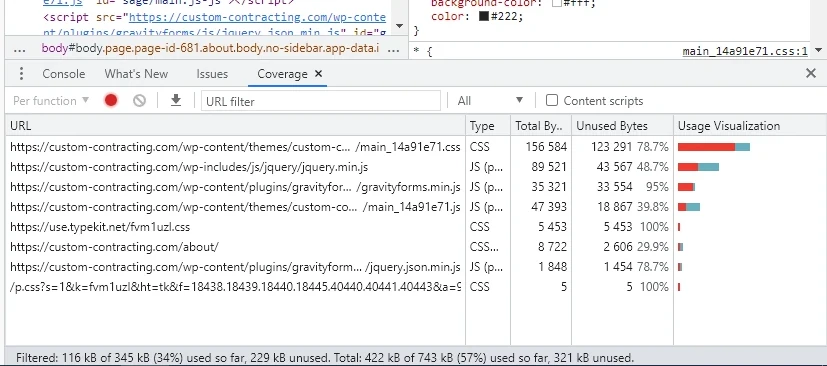
Script Coverage Tool, to determine script usage
Once the page has rendered, you'll be left with a list of files, their type (e.g. CSS or JavaScript) along with their size, the number of bytes in each file not being used, and the percentage of non-use. As you can see, in the image above, the file fourth from bottom (a CSS file) is not being used at all on that page, as it indicates 100% unused bytes.
Ideally you'd like figures of 0 and 0% in the unused bytes column, meaning the file is fully utilized but you'll rarely be so fortunate. The CSS file identified as being unused is only 5,453 bytes (very small), so it likely makes little difference, but the CSS file in the top line is much larger, and is 78% unused (123,291 bytes of that file are unused on the page which was tested).
The last column in the display shows Usage Visualization; the files displaying a bar which is mostly red have a low percentage of coverage (i.e. little of the code is used on this page); you'd much rather have no red at all, which means the code is well-utilized.
Step 6:
Now for the really useful part: if you select a file name in the Coverage section (click on the file name/URL), another little window will become visible, displaying the code of the file in question. It will indicate the sections of code which are being used or unused. A green-turquoise line at the side denotes the code in use, while a red line at the side denotes code which is never used on the page. You should scroll through the file to see which pieces of the code are used and unused.
Using the knowledge of which code is being used and which code is never used, you may be able to trim down some of your code, or just copy the bits which you do use into separate files, and load those instead of the bigger files which are poorly utilized.
Remember that just because JS or CSS code may not be used on one page of the site, doesn't mean that it isn't used anywhere; some of it may be used elsewhere on your website.
The image below shows something similar to what you'll see when you select a filename to display:
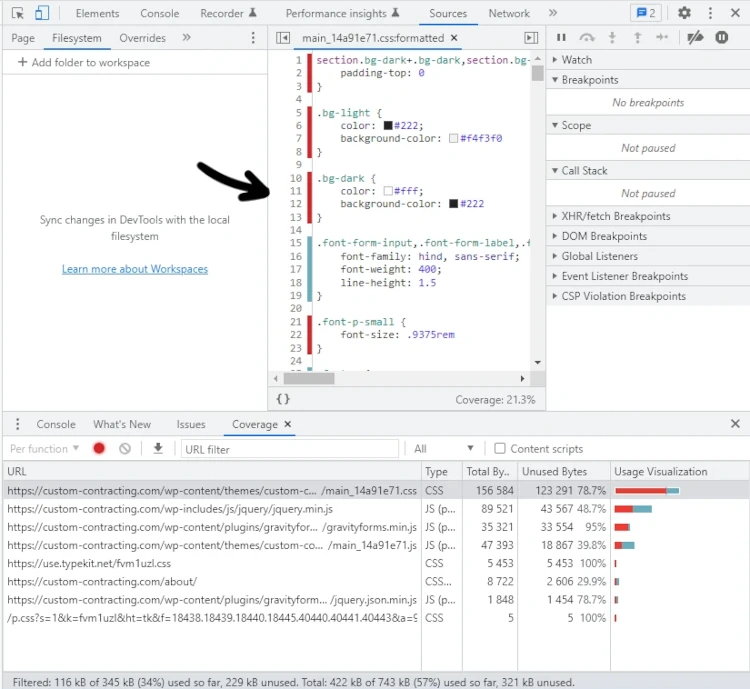
Checking Script Usage
As you can see in the image above, in the small section of code which is visible, the script usage tool has identified that only one of the CSS rules is being used (green-turquoise); the other four CSS rules are not used at all on the page being tested (although they may be used on other pages).
Now, using the information you have of which code is being used or not, you may be able to trim back some of your CSS or JavaScript code. You may be able to just copy the bits which you do use into separate files, and load those instead of the bigger files which are poorly utilized. Or you may be able to develop some programming logic to load only certain JavaScript or CSS files into certain pages.
Before leaving you to experiment, remember that just because JS or CSS code is identified as being unused on the page you test, it may still be used elsewhere on your website. So, before getting too excited with your code-chopping, remember to test things well. And then test it again!
Hopefully you found the information here useful! Good luck with your coding and optimization!